
360° Imagery vs. LiDAR: Choosing the Right Tool for Utility Pole Surveying
Introduction
Utility companies and telecom operators are under more pressure than ever to acquire and implement pole data. Broadband buildouts are racing against BEAD funding deadlines, joint use attachment processes are slow and field crews are managing their limited resources as workloads expand. When an industry finds itself under that kind of pressure, the instinct is usually to turn to familiar tools and technologies to meet project goals. In utility surveying, that technology is LiDAR. It is an impressive tool, capable of mapping entire corridors down to the centimeter. But when a telecom company just needs to know where a pole sits and how high its attachments are, do they really need a full 3D model of everything surrounding it? In most cases, no. And that gap between what LiDAR produces and what most distribution-level pole work requires is the basis of this article.
What LiDAR Actually Is
LiDAR stands for Light Detection and Ranging. At its core, it is a measurement system that fires rapid pulses of laser light at a surface and measures how long each pulse takes to return. From that time-of-flight calculation, the system builds a precise three-dimensional map of everything in its field of view, known as a point cloud. In the context of the grid, that point cloud captures far more than the pole itself; it captures the pole and everything around it, from surrounding vegetation to nearby structures, all rendered as a dense cluster of individual data points.

A LiDAR point cloud of an intersection.
LiDAR has been commercially available since the late 1990s, and the technology has matured considerably since then. Modern systems can capture millions of data points per second at sub-centimeter accuracy, and they come in three basic formats. Mobile rigs mount to a vehicle and can cover over 50 miles of corridor a day at highway speeds. Airborne systems, flown on drones or fixed-wing aircraft, survey wide areas in a single pass and are especially useful for large-scale asset inventory or vegetation encroachment analysis. Static, tripod-mounted units fill in the gaps that vehicles and drones cannot reach, though they are slower and more labor-intensive to deploy.
Where LiDAR earns its reputation is at scale and in complexity. For transmission line corridor surveys, it can measure conductor sag and catenary over long spans between structures. For vegetation management, it can penetrate canopy in a way that photography simply cannot, which is why companies performing structural wind-loading analysis across thousands of poles rely on it. And for predictive modeling, LiDAR-derived topography feeds directly into platforms like ArcGIS to model things like substation flood risk. These are genuinely complex spatial problems, and LiDAR remains the right tool for solving them.
Why LiDAR is Overkill in Distribution Work
The trouble starts when that same technology gets applied to everyday distribution pole work, which is where the bulk of make ready and joint use projects actually live. A point cloud is a three-dimensional representation, not a measurement tool. The objects inside it, whether that is a pole, a crossarm, or a transformer, do not carry any inherent measurements or attribute data. Before an engineer can extract a usable number, that point cloud has to be processed in a platform like AutoCAD or ArcGIS, and that processing step is neither fast nor free. It is an extra layer of considerable time and cost that most distribution-level workflows were never built to absorb.
Cost is the other half of the problem. Comprehensive per-pole analysis, including both collection and processing, typically runs $40 to $80 a pole, and that is before any engineering happens. Large land surveys run $0.13 to $0.26 a foot, while more targeted, high-accuracy collections push toward $0.75 to $2.00 a foot. Equipment alone can run anywhere from $50,000 into the hundreds of thousands of dollars, and that is money spent before a single pole gets surveyed. Then there is the practical friction of the output itself: point cloud files range from a few gigabytes to multiple terabytes, and moving files of that size through an organization's existing systems creates real headaches. Perhaps most inconvenient of all, LiDAR cannot read a pole tag. Birthmark and specification data, the kind of detail engineers need for pole loading analysis, still requires a separate ground-truth visit, which quietly erodes a lot of the efficiency argument for using LiDAR in the first place.
None of this makes LiDAR a bad technology. It makes it a technology built for a specific scope, and most day-to-day distribution work simply is not that scope.
How 360° Imagery is Used in Utility Surveying
360° imagery works on an entirely different principle. Rather than measuring distance with laser pulses, a camera system captures a full spherical view of a scene in a single shot using multiple lenses simultaneously, and those images are stitched together into a seamless, navigable sphere. Think Google Street View, but deployable anywhere the camera can go, whether that is mounted on a vehicle, a drone, a backpack, or a pole. When that imagery is integrated with RTK-corrected GPS, every frame is tied to an exact ground location at sub-centimeter accuracy, rather than the several-meter drift you get from standard GPS.
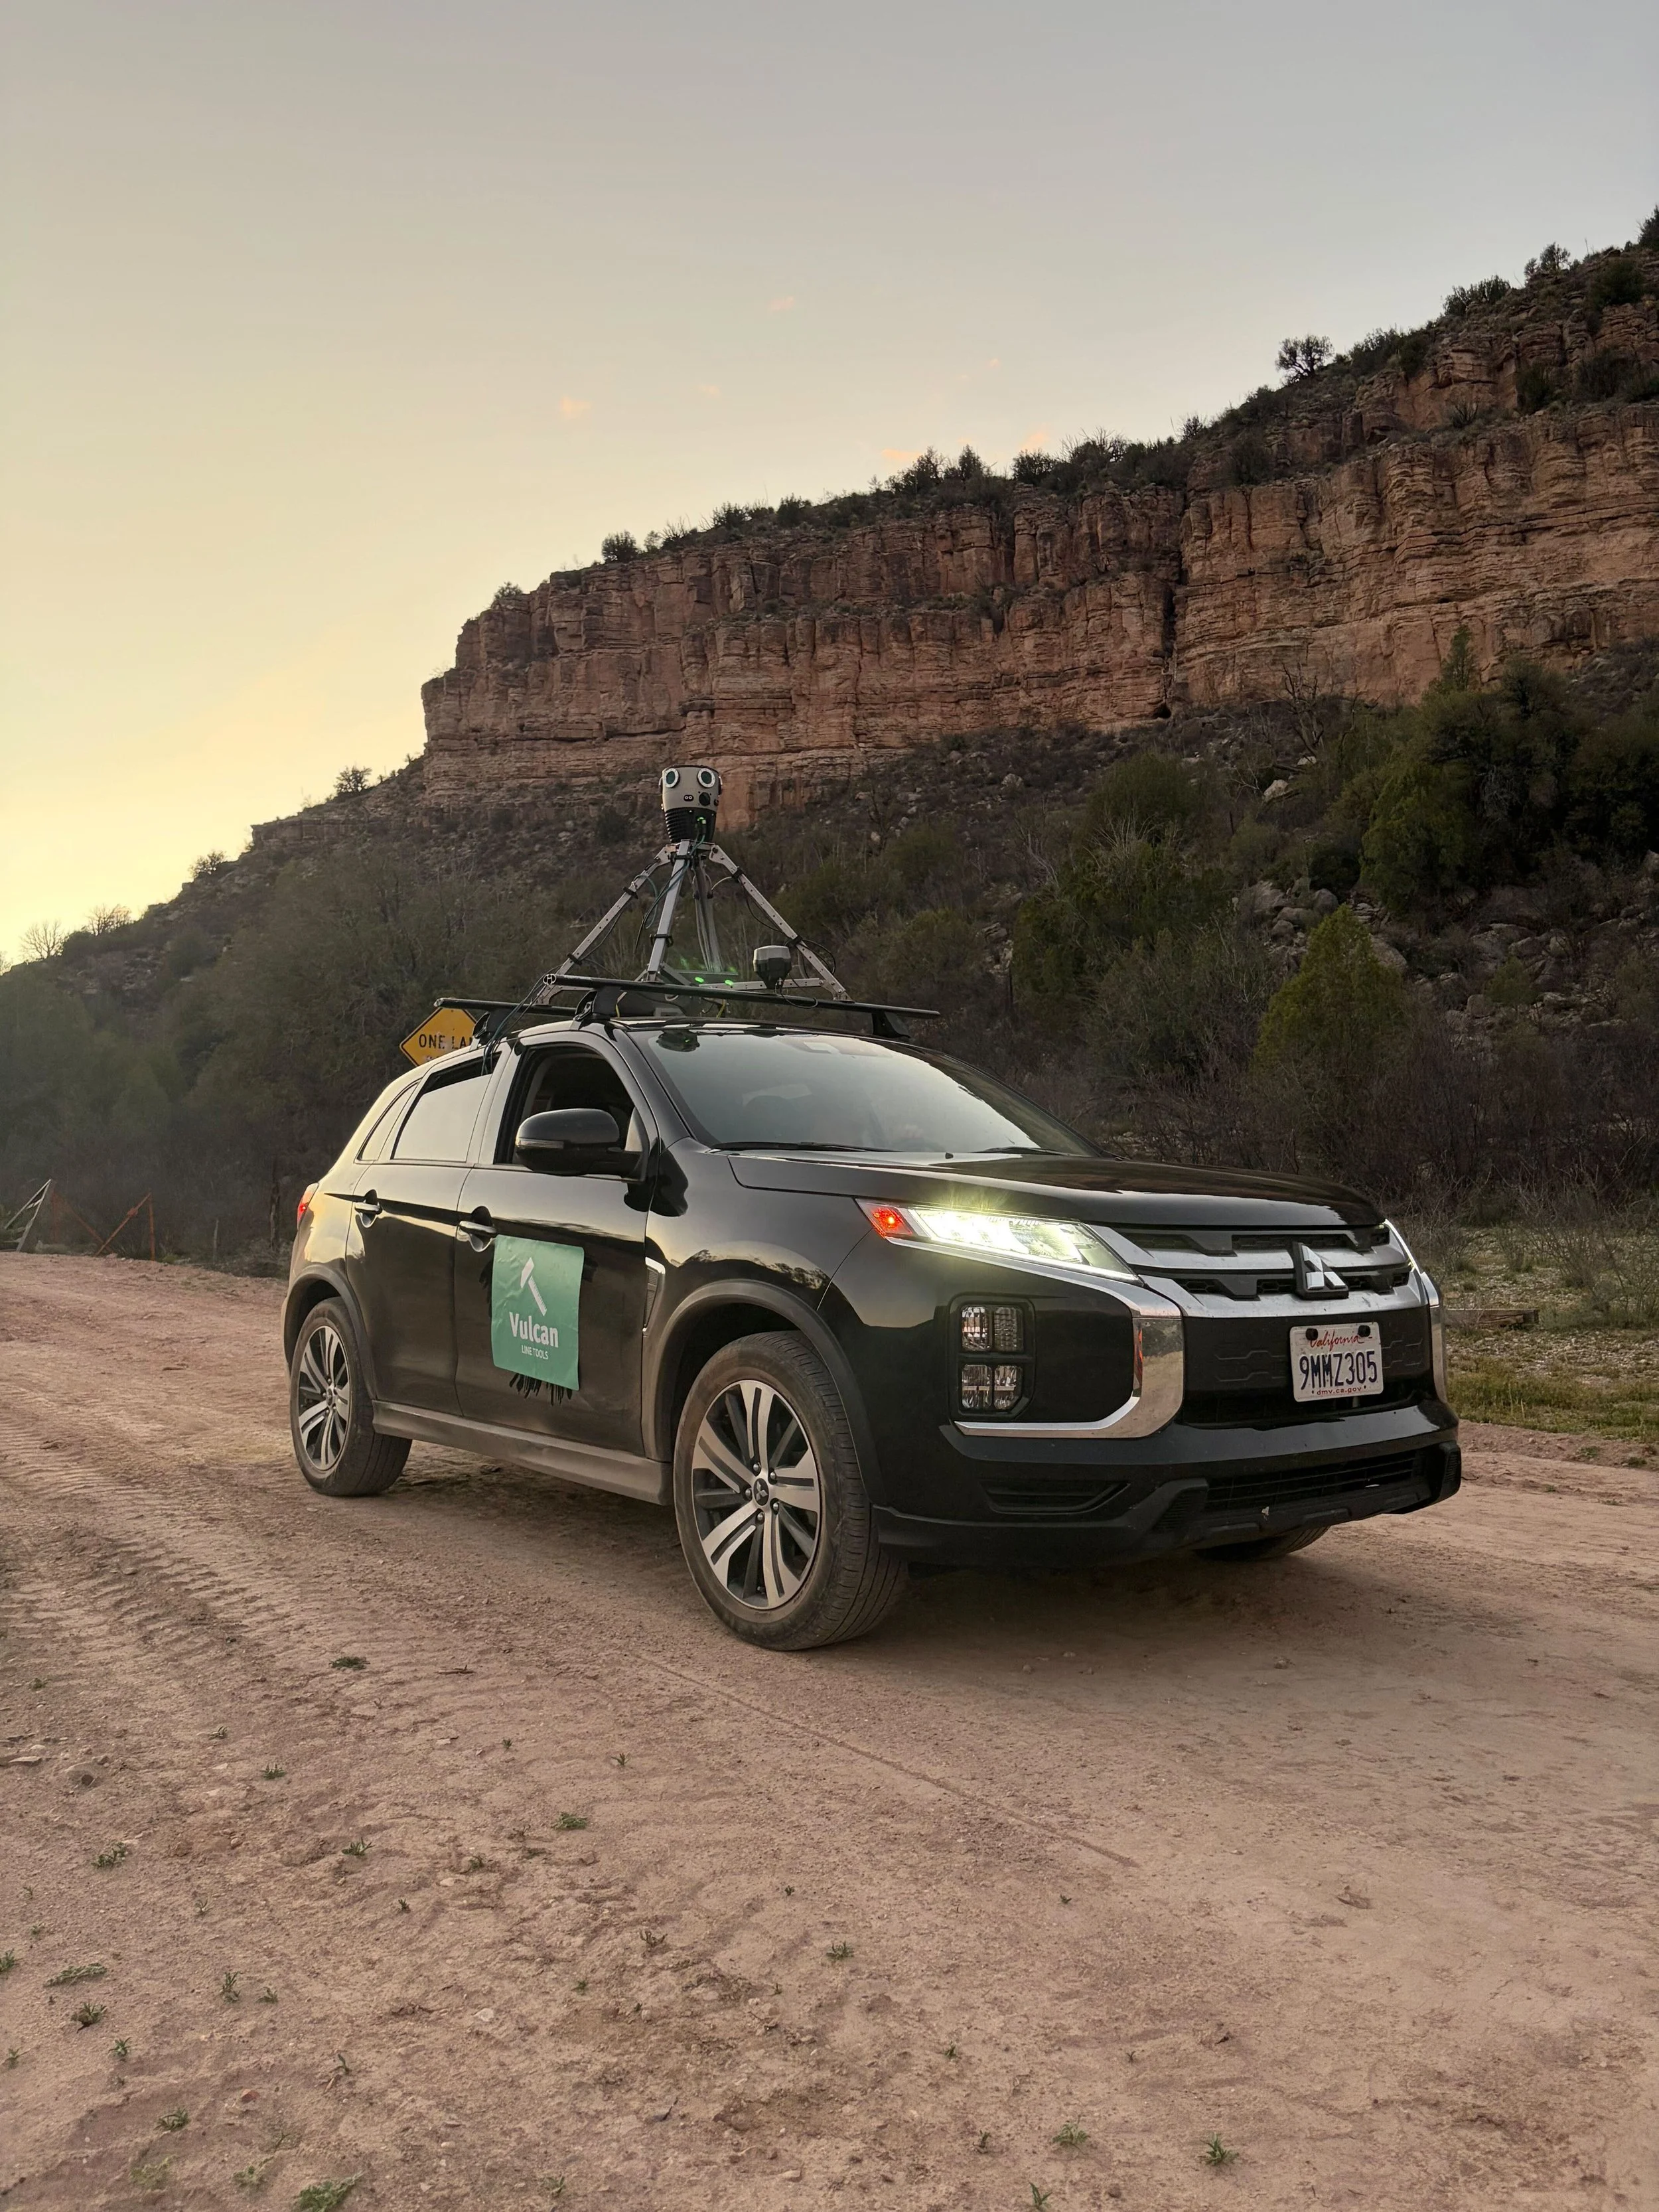
A Vulcan Line Tools vehicle with a 360° camera setup performing a collection in rural Arizona.
In practice, a vehicle-mounted camera can drive an entire corridor and capture every pole and span in a single pass without ever stopping, with each frame geotagged to centimeter-level precision as it goes. Field crews or office engineers can then use that imagery to document pole conditions, identify attachments, and assess make ready status without a return trip. Because the imagery is tied to precise coordinates, poles can be located and reviewed accurately inside a GIS platform, and stakeholders, engineers, or permit reviewers can virtually walk a corridor from a browser rather than driving out to see it in person. The biggest strength of this approach is speed, cost, and accessibility. Imagery can be collected at highway speeds across an entire area, reviewed the same day it is uploaded, and shared instantly with anyone who needs it.
Criticisms of 360° Imagery
For a long time, the honest criticism of 360° imagery was fair: it is a visual tool, not an engineering one. You could see that an attachment existed at roughly a certain height, but you could not pull an actual number out of the image without some additional layer of software. Raw imagery cannot produce measurements, load analysis, or spec data on its own, and for engineers who need exact numbers for make ready or pole loading work, that gap mattered. It is a fair criticism, and it is the reason 360° imagery spent years being treated as a documentation tool rather than a surveying one.
Our Solution
This is where our approach at Vulcan Line Tools comes in. We did not just adopt 360° imagery as a documentation tool; we built a platform around it that closes the measurement gap. Our car-mounted camera captures 13.5K resolution 360° imagery paired with RTK-corrected GPS at sub-centimeter positional accuracy, so every frame is tied to an exact location on the ground, not an approximate one. That imagery uploads to Azmyth™, our proprietary GIS and surveying platform, where engineers can extract virtual measurements of pole heights, attachment points, and midspan clearances directly from the imagery itself, with no return field visit required. Measurement accuracy in Azmyth is consistently within half an inch, which is engineering-grade precision without the engineering-grade price tag or timeline.
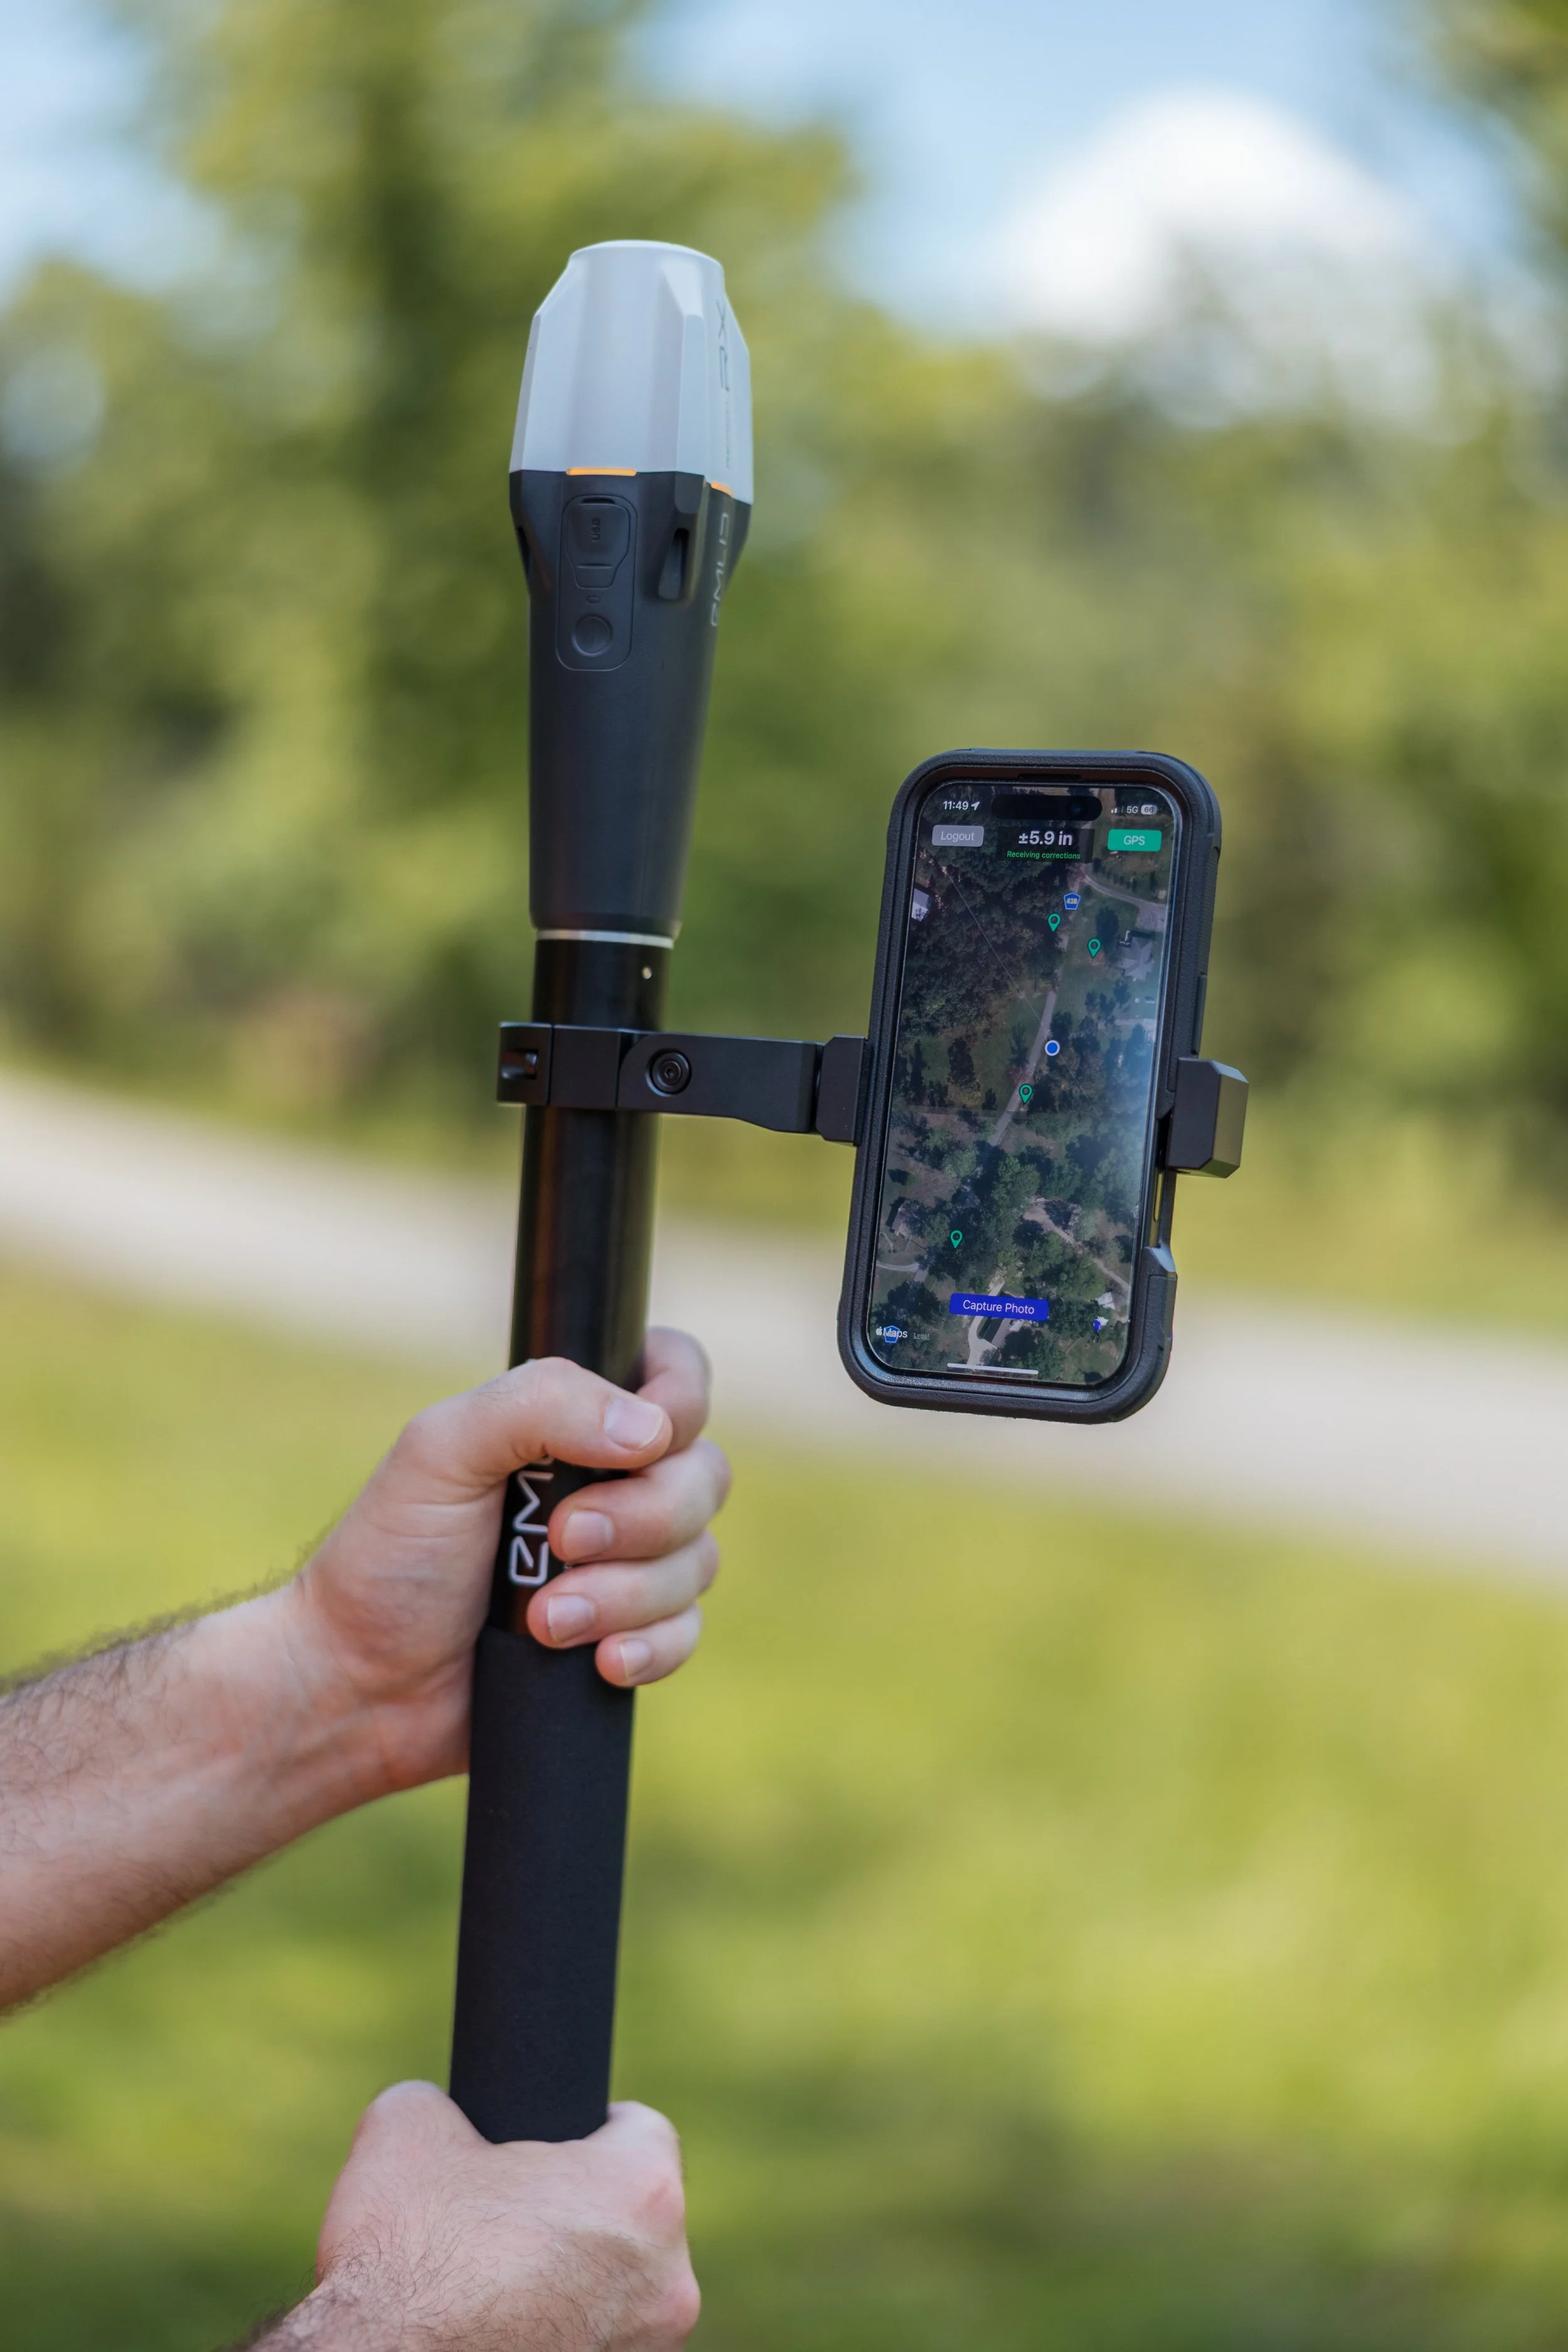
The Azmyth on Foot app open on an iPhone
That combination powers the services we run every day. Our Red/Yellow/Green make ready assessment categorizes poles as RED when power make ready is needed, YELLOW when comm. make ready is needed, and GREEN when no make ready is required at all, and we complete thousands of these assessments weekly without ever putting a crew at every structure. Our Joint Use Audit identifies who is attached to a pole, what condition it is in, and where those attachments sit, delivered as a detailed report across an entire area. And for the poles a vehicle cannot reach, whether that is a rear-lot easement or a structure set back behind a ditch, our mobile app, Azmyth on Foot, extends the same RTK-corrected workflow to a smartphone, so nothing gets left out of the dataset just because a truck cannot get to it.
We are candid about what this approach is not. It does not produce a full 3D point cloud of the surrounding environment, and it is not trying to. What it produces is exactly what most distribution-level make ready and joint use work requires: pole locations, attachment heights, span measurements, and make ready status, delivered same-day and exportable into any of the standard file types engineers already use. Compared to $40 to $80 a pole for LiDAR-based distribution surveys, our imagery collection services are a fraction of the cost and Azmyth subscriptions are $25 a month for the standard platform or $100 a month for Azmyth on Foot, which changes the math on a project of any real scale.
Choosing the Right Tool for the Job
The honest answer, and the one we tell customers directly, is that LiDAR and 360° imagery are not really competing for the same work. They are solving different problems, and the right choice comes down to what the deliverable needs to be.
LiDAR is still the right call for transmission corridor surveys, dense-canopy vegetation management, substation flood or topographic modeling, and any project where a genuine 3D model of the surrounding terrain is part of the deliverable. If your team is evaluating structural wind loading across thousands of poles or modeling conductor sag over a mountain crossing, that is exactly the kind of complex spatial analysis LiDAR was built for, and no other technology captures that data as completely.
360° imagery paired with a platform like Azmyth is the better fit for distribution-level make ready assessments, joint use audits, OSP engineering, and any project where remote stakeholder review matters as much as the underlying accuracy. It is also the more practical choice whenever budget or timeline is a real constraint, which describes most broadband buildouts working against BEAD funding deadlines right now. For a standard make ready project spanning a few hundred to a few thousand poles, the savings are not marginal. They are the difference between a project that pencils out and one that does not.
Learn More:
To see how our approach fits into a broader field data collection strategy, visit our Utility & OSP Data Collection page, or learn how Azmyth powers make ready assessments and joint use audits on our Make Ready & Joint Use page. For a deeper look at manual, aerial, and mobile collection methods side by side, read our earlier piece, How to Collect Field Data on Power Poles. And if you are ready to see what Azmyth can do for your next survey, contact our team for a quote.